-
Category:
Graphic Design
-
Client:
Vendly (E-commerce Analytics)
-
Location:
Dubai
-
Industry:
E-commerce
-
Stack:
UI/UX Design,Website development
1. The Challenge
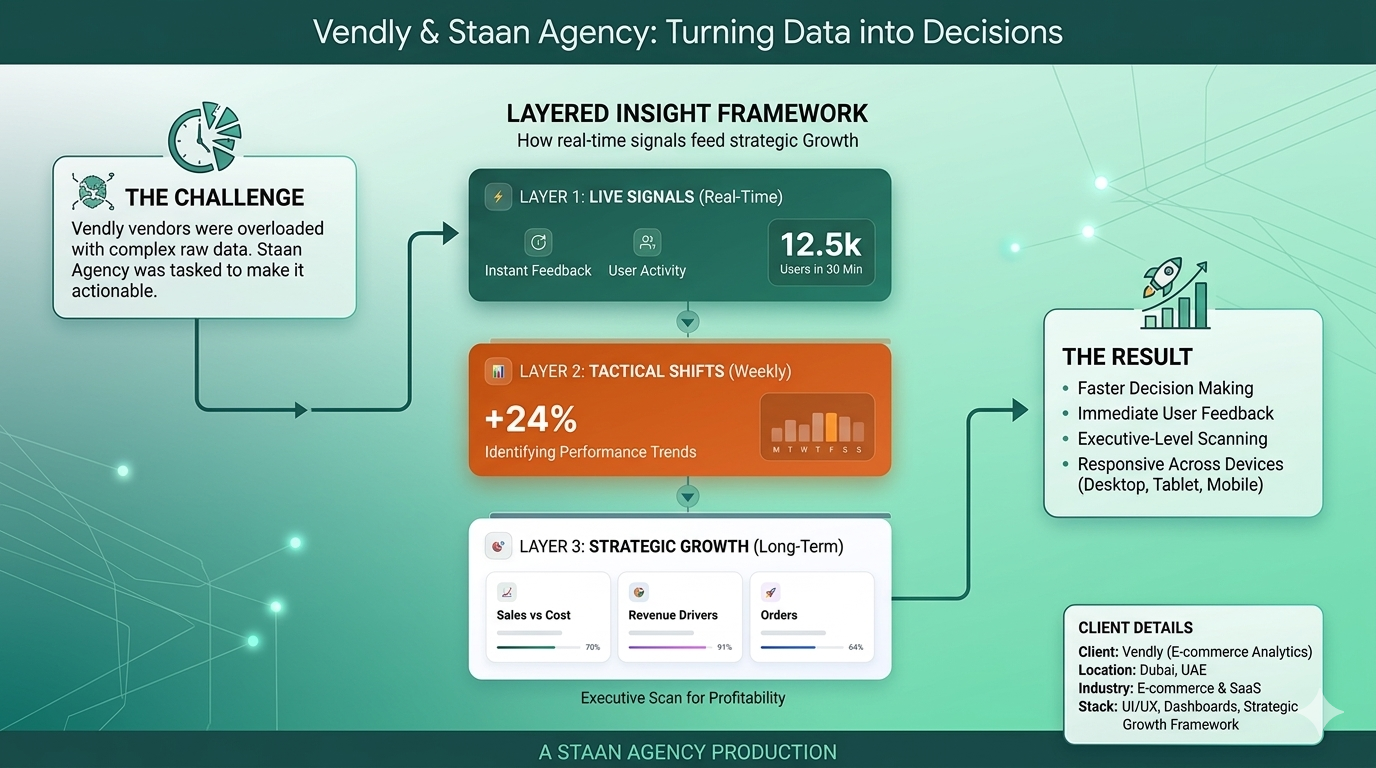
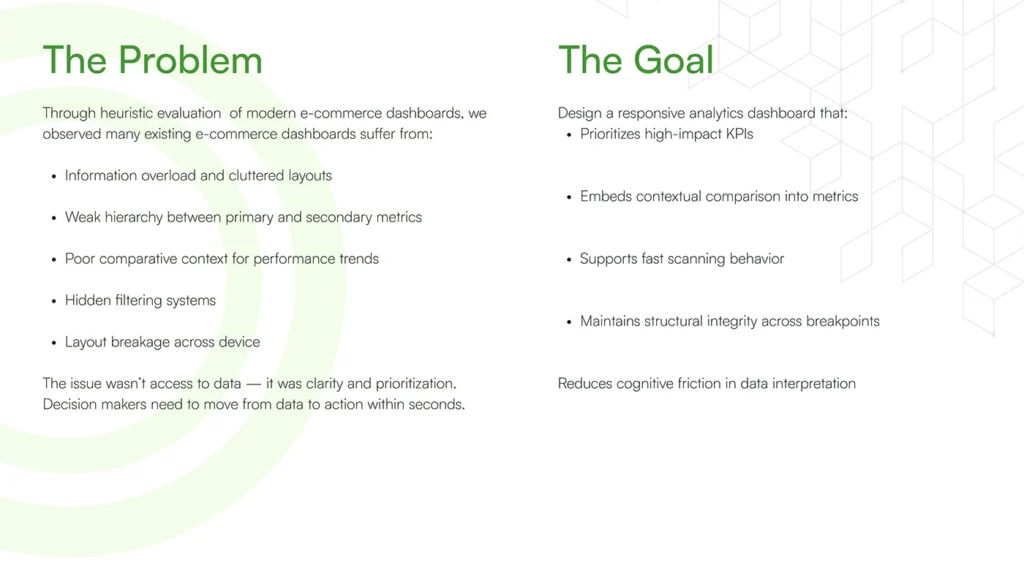
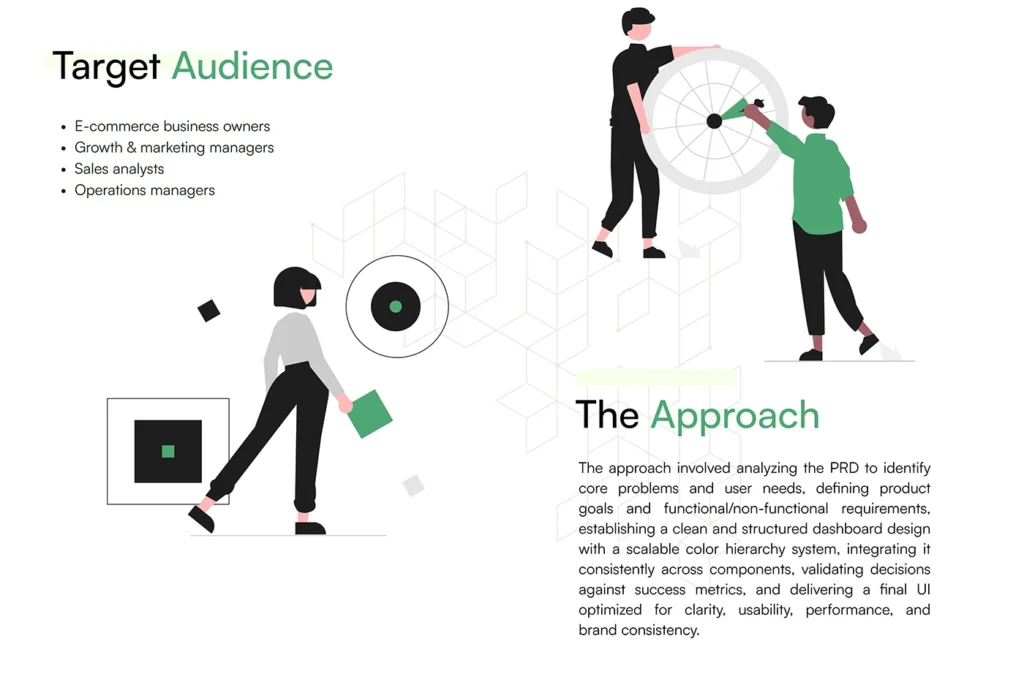
E-commerce business owners and growth managers often struggle with Data Overload. For Vendly, the primary challenge was that their raw data was too complex for vendors to interpret quickly.
Key Problems Identified:
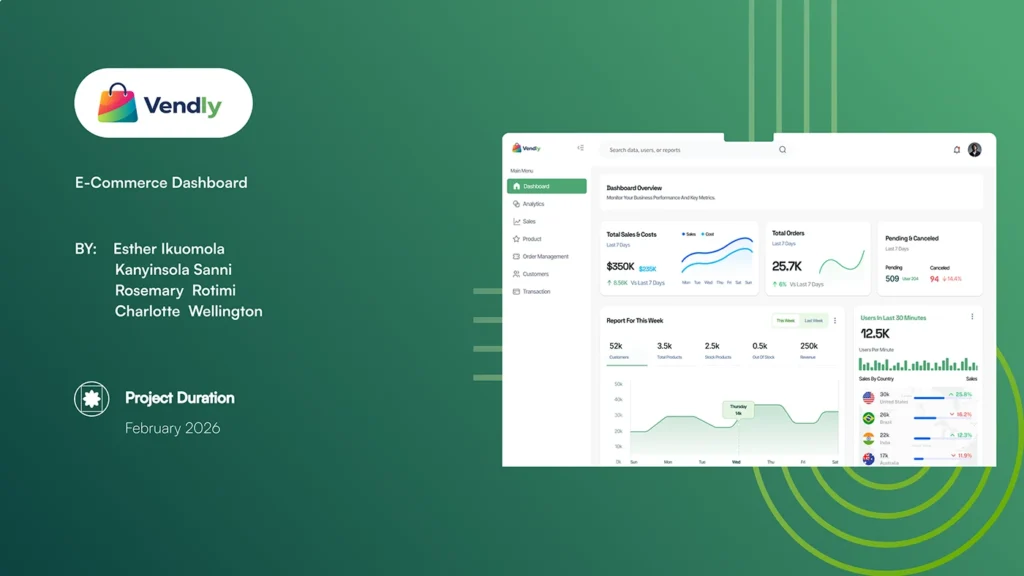
- Information Fragmentation: Vital metrics like sales, orders, and customer insights were scattered, making it hard to see the “big picture.”
- Lack of Real-Time Clarity: Vendors had no immediate way to see live activity, leading to delayed reactions to business changes.
- High Cognitive Load: The previous interface was built around technical components rather than the actual decisions a business owner needs to make daily.
2. What Did Staan Agency Do?
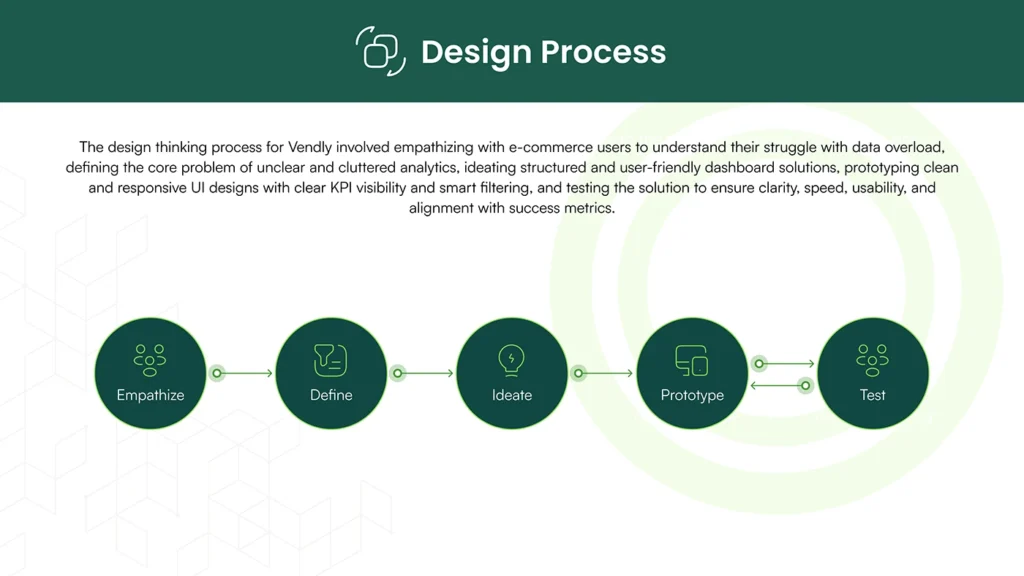
We transformed Vendly’s complex data into a Layered Analytics Framework. Our approach focused on moving vendors from “Live Signals” to “Strategic Growth.”
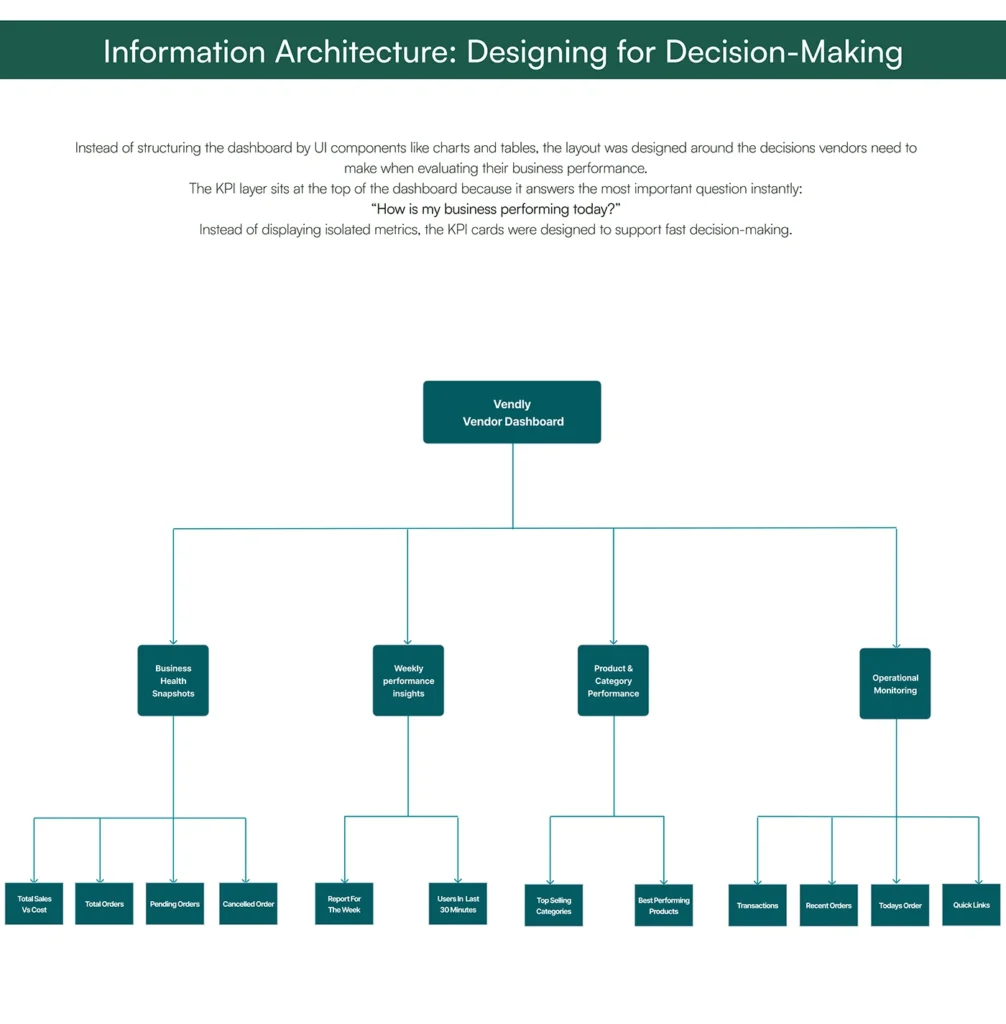
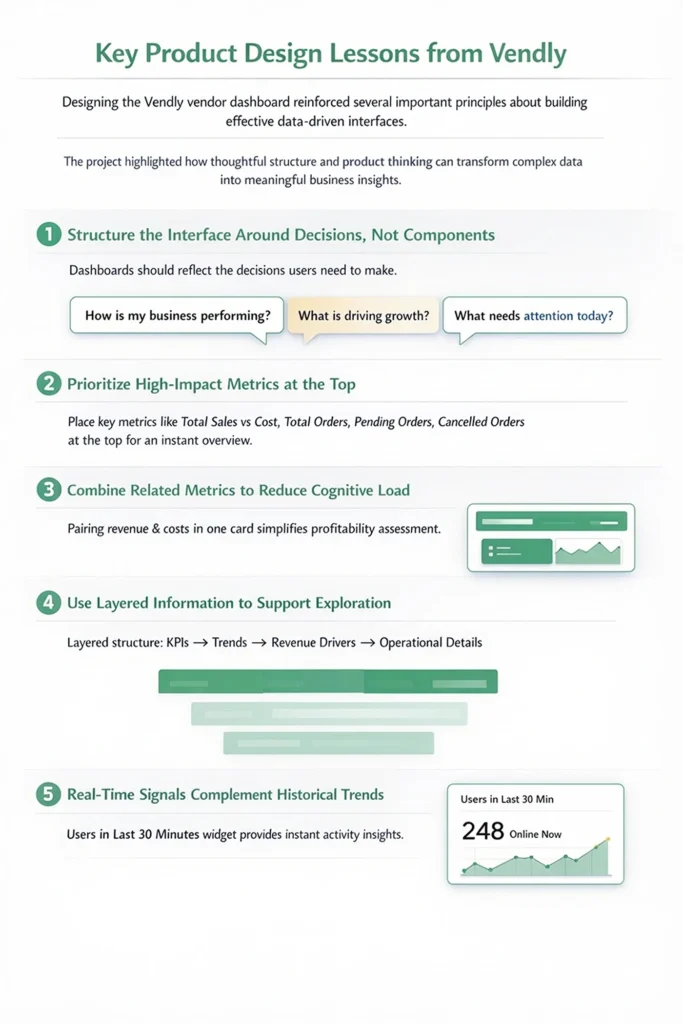
- Decision-First Architecture: Instead of just showing charts, we structured the interface around three core questions How is my business performing? What is driving growth? and What needs attention today?
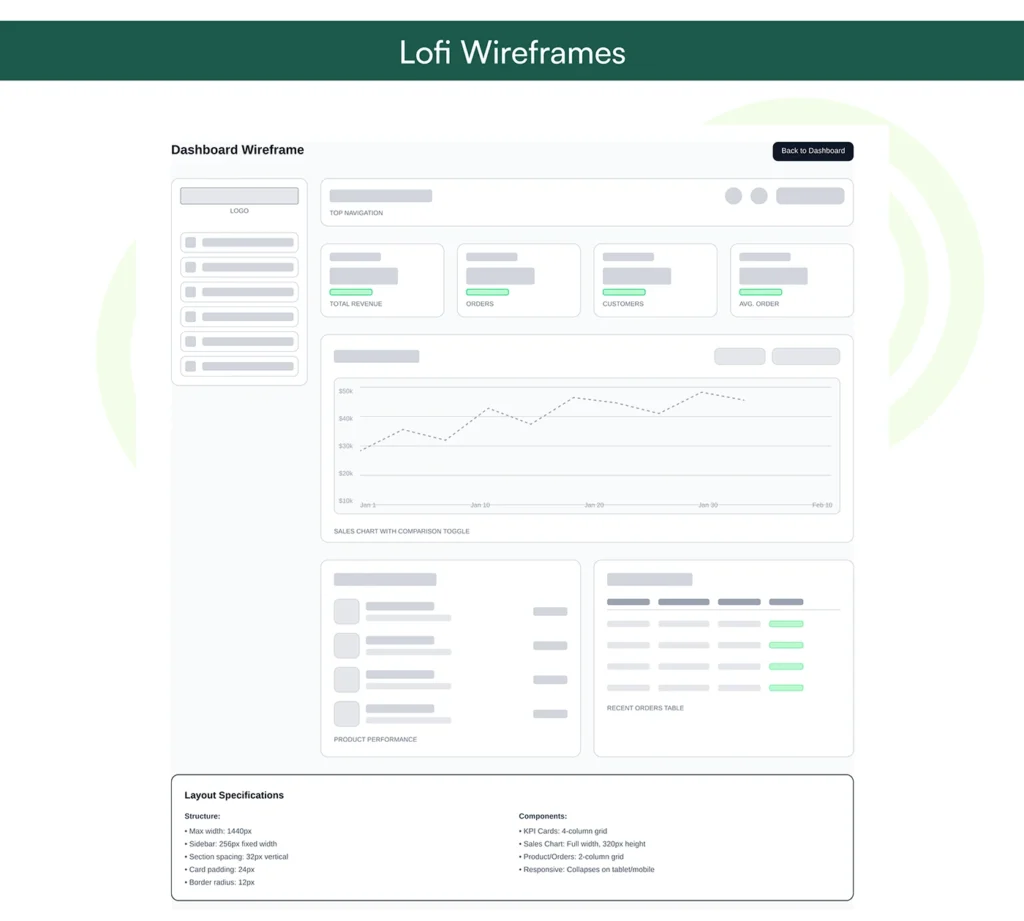
- The Three-Layer System: 1. Layer 01 (Real-Time): Developed a Live Signal Monitor for instant feedback on current user activity. 2. Layer 02 (Weekly Trends): Created a dedicated layer for tactical shifts and emerging patterns. 3. Layer 03 (Strategic): Built a long-term performance view focusing on “Sales vs. Cost” and Revenue Drivers.
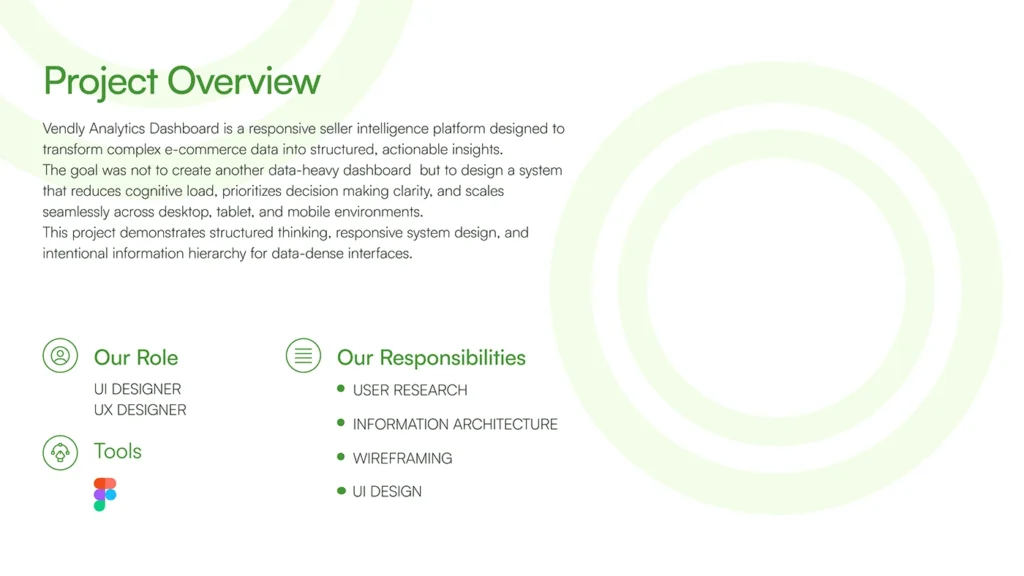
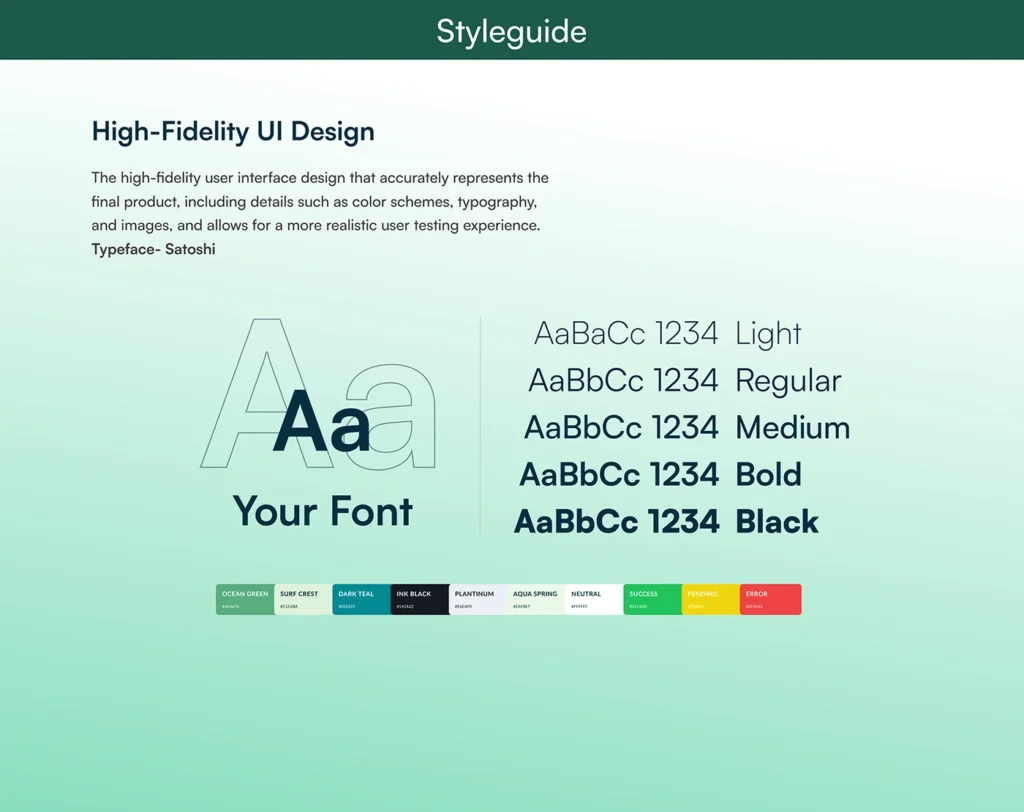
- UI/UX Optimization: We implemented a high-fidelity design using the Satoshi typeface and a professional color palette (Ocean Green and Dark Teal) to ensure maximum readability and executive-level scanning.
- Responsive Ecosystem: We designed fully optimized versions for Desktop, Tablet, and Mobile, ensuring the dashboard is accessible anywhere.
The Result
Staan Agency’s intervention turned a cluttered data tool into a streamlined growth engine for Vendly vendors.
- Faster Decision-Making: By pairing related metrics (like Revenue and Costs) into single cards, we simplified profitability assessments and reduced user fatigue.
- Enhanced Real-Time Monitoring: The “Users in Last 30 Minutes” widget provided instant activity insights, allowing vendors to validate marketing campaigns in real-time.
- Scalable Framework: The implementation of a clean style guide and structured dashboard layers means the platform can now scale with new features without losing its clarity.
- Professional Brand Consistency: The final UI achieved a perfect balance between high-end aesthetics and functional performance.

Case Study
See Our More Case Study That You Want.
Graphic Design
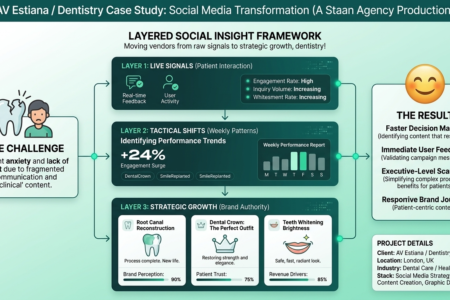
Case Study: Social Media Transformation for Dental Clinics
1. The Challenge Most dental clinics struggle with patient acquisition because people often view dental visits with fear, anxiety, or…
Learn More